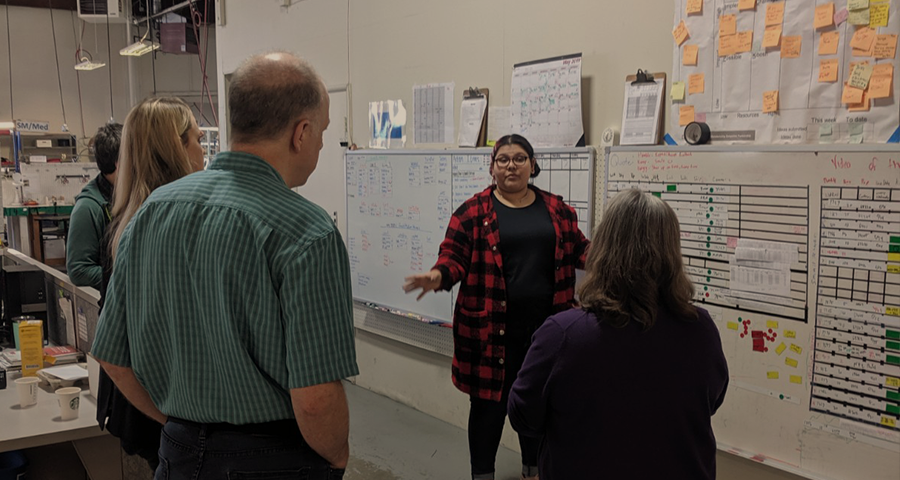
We as managers often believe that our teams understand our company values, strategic direction, and key measurement of those initiatives merely through association. We may even tell our employees about our strategic direction and goals during our onboarding process, and assume that the message got through. Although we’d like to think that is true, verbal or written descriptions of goals and performance metrics don’t work. We’ve seen over and over with clients that visual measurement systems are much better at keeping employees engaged and attentive to the way their daily work meets goals.
Yet, visual systems are difficult to get right. We as leaders should be able to distill the company values, strategic direction, and sales goals into digestible information so that employees can focus on helping achieve them. This supplements our verbal communication and ensures that we are all looking at the same goals/metrics. In many ways, it is easier said than done.
I was visiting a large multinational supplier a few years ago and walked into their meeting room. On three sides of the room were 4’ x 8’ whiteboards covered with charts. (Approximately 20 charts per board) I asked what these charts were and was told they were the Key Performance Indicators (KPIs) for the company. When I asked which ones were the most important, they said they ALL were. I asked how the employees knew what to focus on in their jobs. Their response: supervisors monitor that.
It’s unfair to put that much pressure on supervisors to navigate an unmanageably large number of KPIs.
It’s true that what gets measured gets done, but the reverse is also true – if you measure too much (or measure the wrong things), nothing gets done.
Focus on the concept of KEY performance indicators is critical for manufacturers. You have so many moving parts to your business (literally and figuratively), so knowing what areas to zoom in on is critical to keeping on track.
Recently the Grow 3 Degrees group met to discuss this very issue. Several companies admitted that they don’t have a visual board the employees can review that outlines values, goals, and successes. They are certainly not alone!
Grow 3 Degrees is hosting a Peer to Peer workshop for companies in the Bend area. Learn More
It takes time and effort to distill company values into measurable numbers that everyone agrees on. If one of your goals is to increase sales by 10%, that’s relatively easy to chart. If one of your values is “the best customer service” that’s a bit more nebulous to manage. How do you track that? Maybe you could track the number of complaint calls/emails you get, and set a goal to decrease those calls by 10%. Or, perhaps you could set a metric that tracks customer repeat purchases.
Many people rely solely on verbal communication or emails to track goals. Yet, to effectively keep a team focused and avoid distraction, keep their eye on your true north. A visual board can be another way of reaching your team – especially those not tuned into verbal communication or do not have access to a company email.
Start with a few key metrics, and expand as needed. Run some mini ‘visual board experiments’ to see which metrics resonate with your team, and how best to display them. As with most processes, less is more. OMEP has a large number of visual tools and technologies that we use to keep our own team on track. If you’d like access to some free visual management templates, reach out and we will help you.


